


Converting website visitors into paying customers remains the ultimate measure of e-commerce success. The average global e-commerce conversion rate in 2025 hovers in the 2%-4% range, making optimization crucial for sustainable growth in today’s digital marketplace. This guide outlines four foundational steps to elevate conversion rates through strategic design, trust-building, checkout optimization, and continuous testing.
Key Takeaway:
- Optimize Website Design: To maximize impact, use high-quality product visuals. Write compelling product descriptions that focus on benefits, not just features. Be transparent with pricing and shipping costs. Ensure the site has intuitive navigation and a clean code base.
- Build Trust and Credibility: Leverage social proof by prominently displaying customer reviews. Implement clear return policies to eliminate purchase risk. Use trust badges and security signals to build confidence.
- Master the Checkout Process: Address the cart abandonment crisis by offering guest checkout. Streamline the checkout flow by reducing form fields. Utilize recovery strategies such as abandoned cart emails and exit-intent pop-ups.
- Continuously Test and Analyze: Prioritize mobile optimization to address the lower mobile conversion rate. Use A/B testing to continuously improve high-impact elements. Use analytics tools like Google Analytics and Hotjar to monitor key metrics and user behavior.
1. Optimize Website Design for Maximum Impact

A. High-Quality Product Visuals: Your Silent Salesperson
Product images will make or break an online store, with compelling statistics that support their conversion impact:
| Visual Impact Metric | Percentage | Key Insight |
|---|---|---|
| Shoppers requiring 3-4+ images | 60% | Minimum image requirement for purchase consideration |
| Shoppers requiring 5+ images | 13% | High-consideration shoppers need extensive visuals |
| Conversion rate improvement (high vs low quality) | 94% | Quality directly impacts sales performance |
| Buyers prioritizing visuals in decisions | 90% | Most important factor in online purchasing |
| Etsy shoppers rating images as crucial | 90% | Platform-specific validation of image importance |
| Conversion rate boost (1 vs 0 images) | 100% | Having any image doubles conversions |
| Conversion rate boost (2 vs 1 images) | 100% | Second image doubles conversions again |
To maximize your visual impact, use high-resolution images that can show the product from different angles and in action (if applicable). Creating a lifestyle context allows potential customers to envision using the product. This can be done through 360-degree views for complex products and maintaining consistent lighting with clean backgrounds. These practices successfully bridge the gap between online browsing and in-store experience.
B. Compelling Product Descriptions: Benefits Over Features
Effective product descriptions utilize effective storytelling to describe how the product will solve the consumer’s problems. Address the 6 W’s and “Who, What, When, Where, Why, and How” in your listing using language that resonates with the target audience.
Focus on benefits rather than technical specifications, using customer-centric language to address their pain points. Listing brief but efficient bullet points outlining key features, paired with answering FAQs (frequently asked questions), will have the customer spending less time wondering and more time wanting. Emotional connections through your language will help those viewing be able to envision how the product will improve their lives.
C. Transparent Pricing and Shipping
Forty eight percent of shopping carts are abandoned due to factors that you, as the seller, have little control over: excessive shipping fees and unexpected costs. Understanding customer behavior around pricing transparency is vital:
| Pricing & Shipping Factor | Percentage | Impact |
|---|---|---|
| Cart abandonment due to shipping costs | 48% | Primary reason for checkout failure |
| Customers willing to meet free shipping minimums | 80% | Opportunity for order value increase |
| Shoppers deterred by hidden costs | 60% | Transparency directly affects trust |
| Cart abandonment from late-revealed shipping | 22% | Timing of cost disclosure matters |
To avoid this, listing all costs upfront and offering free shipping with minimum order thresholds leads to 80% of customers now open to reaching this mandatory spend. Providing multiple delivery options appeals to different preferences but be sure to use shipping calculators prior to checkout for accurate cost estimates and any additional fees that are tied to this. Transparency here eliminates surprises and builds confidence in your pricing structure.
D. Intuitive Navigation and Clean Code
To enhance one’s listing, it’s important to design the site with both users and search engines in mind. Implement a clear information hierarchy and robust search capabilities with suggestions for an easy user experience, and have it built on clean, professionally-coded architecture for improved search rankings and high search engine rankings.
An organization using logical category structures with robust search functionality and filters makes it easy to find what you’re looking for. Use breadcrumb navigation for easy backtracking, ensure fast page load times under 3 seconds, and optimize for both desktop and mobile experiences.
2. Build Trust and Credibility
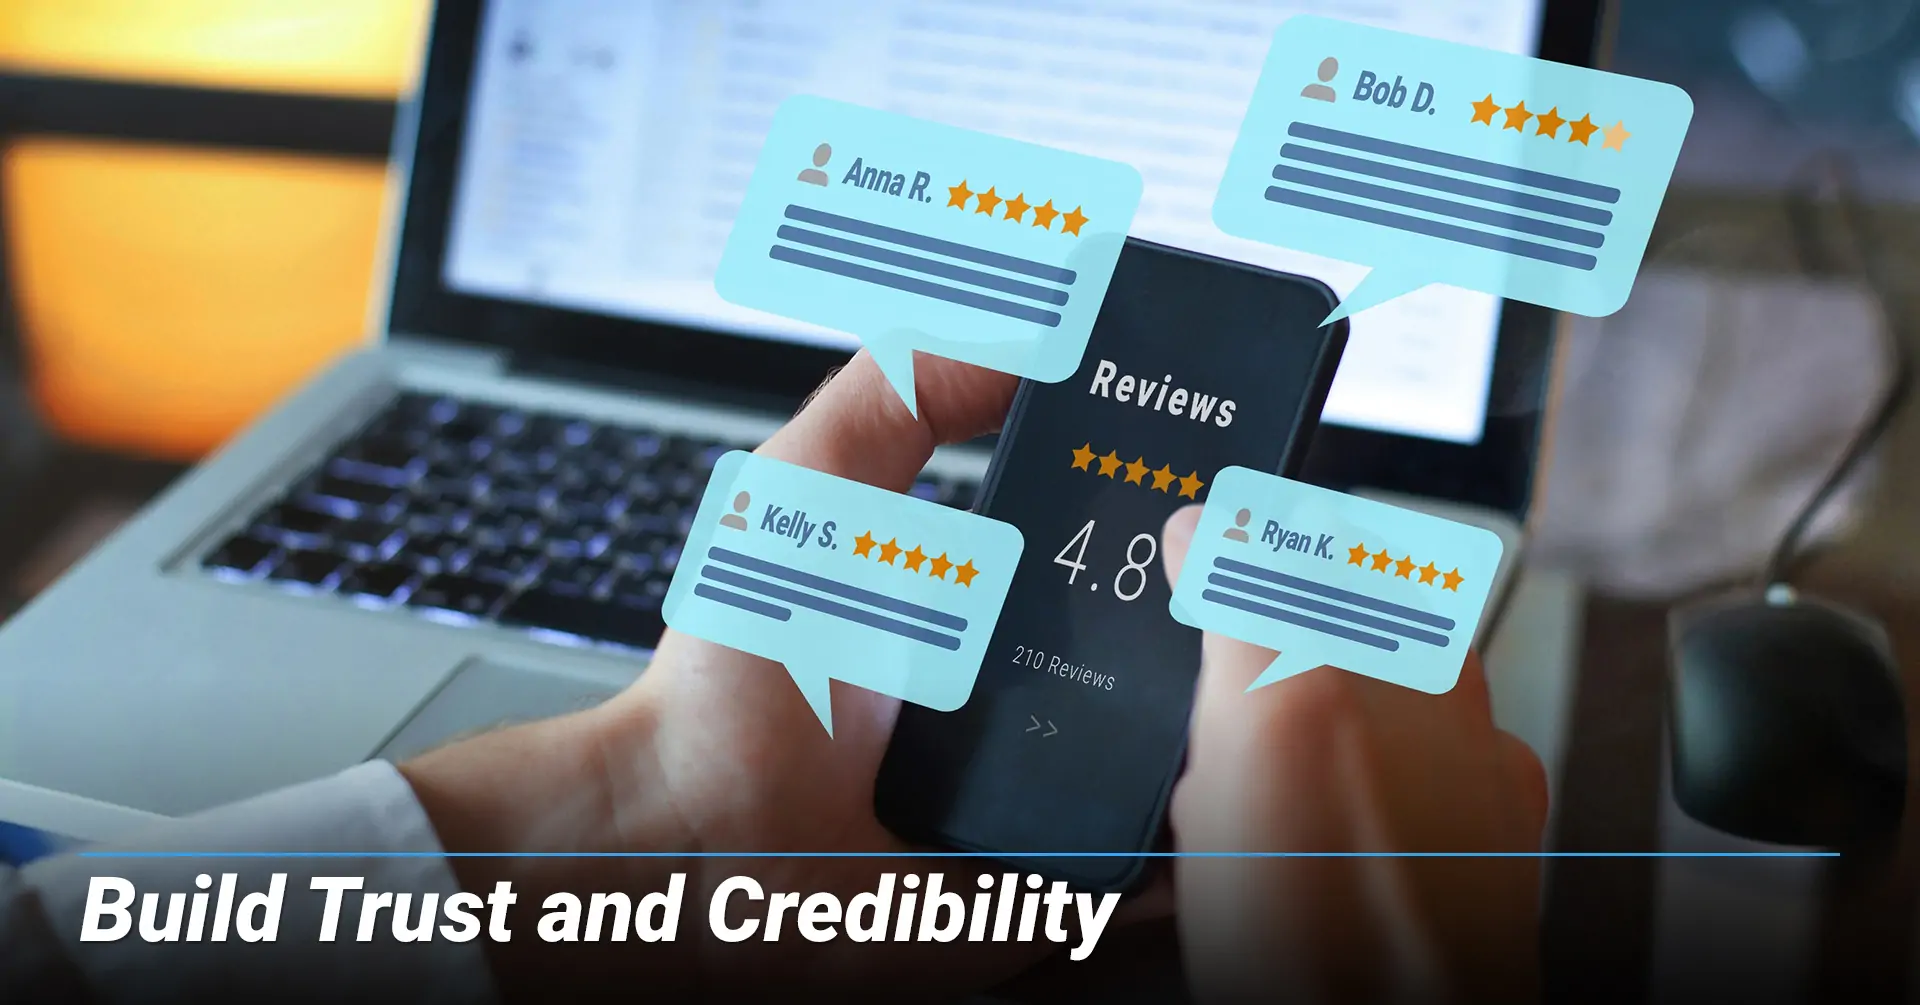
A. Leverage Social Proof
Customer reviews and social proof drive significant conversion improvements:
| Social Proof Metric | Percentage | Significance |
|---|---|---|
| Shoppers checking reviews before purchase | 99.9% | Nearly universal behavior |
| Trust increase when showing positive & negative reviews | 68% | Authenticity builds credibility |
| Consumers trusting balanced review displays | 68% | Mixed reviews appear more genuine |
| Return likelihood with hassle-free returns | 92% | Customer retention impact |
Place reviews prominently on product pages and respond to all feedback in a professional and prompt manner. Request reviews 7-10 days after shipping completion. Consider offering small incentives for honest feedback (e.g., 10% discount on the next order) and feature customer photos and video testimonials. Doing so not only legitimizes your product but also your business to future consumers.
B. Clear Return Policies
Return policies significantly influence customer purchasing decisions:
| Return Policy Impact | Percentage | Business Effect |
|---|---|---|
| Shoppers deterred by inconvenient returns | 80% | Major barrier to purchase |
| Return likelihood with hassle-free process | 92% | Customer retention boost |
| Average return window expectation | 30+ days | Industry standard requirement |
Having return policies that are prevalent and offering a return window of more than 30 days incentivizes shoppers to make a purchase. Providing prepaid return labels, when possible, clearly explaining the return process step-by-step, and offering exchanges as alternatives to returns are great examples of memorable customer service when things don’t go as planned. Doing so helps eliminate the risk of online buying and encourages clients to click “Submit Order.”
C. Trust Badges and Security Signals
Trust badges create measurable improvements in conversion performance:
| Trust Signal Type | Conversion Impact | Customer Response |
|---|---|---|
| Sites with prominent trustmarks | +36% sales | Significant revenue increase |
| Shoppers feeling confident with badges | 48% | Nearly half of all customers |
| Security badge impact on conversions | +42% | SSL certificates boost confidence |
| Payment badge influence on purchases | +32% sales | Familiar logos drive action |
| Abandonment without trust signals | 61% | Missing badges cause exits |
Display SSL certificates and security badges near payment forms, showcase payment method logos like Visa, PayPal, and Apple Pay, and prominently feature money-back guarantee badges on product pages. Include third-party endorsements such as BBB (Better Business Bureau) ratings and Trustpilot scores, along with relevant industry certifications and compliance badges. These visual cues settle any worries that may arise regarding security and legitimacy.
3. Master the Checkout Process

A. Address the Cart Abandonment Crisis
The average cart abandonment rate is 70.19%, representing a massive loss of revenue. This can be attributed to any of the following specific optimization opportunities below:
| Abandonment Reason | Percentage | Optimization Priority |
|---|---|---|
| High shipping costs | 48% | Critical – Address pricing transparency |
| Mandatory account creation | 26% | High – Implement guest checkout |
| Slow delivery times | 25% | High – Improve logistics communication |
| Complicated checkout process | 18% | Medium – Streamline form fields |
| Payment security concerns | 17% | Medium – Add trust signals |
This chart reveals that most abandonment reasons are preventable through improved design and communication. By addressing these core issues systematically, you can recover a significant portion of otherwise lost sales and dramatically increase conversion rates.
B. Streamline the Checkout Flow
The average US checkout flow contains 23.48 form elements, but an ideal checkout can be as short as 12 to14 elements. Easier processes improve conversions through reducing friction and decision fatigue.
Reduce form fields to only require essential information and implement progress indicators that show checkout steps. Utilize address auto-fill and validation features, offer one-page checkout whenever possible, and optimize your site specifically for mobile devices. Enable autofill for returning customers to create a smooth user experience that encourages repeat purchases.
C. Guest Checkout vs. Account Creation
Offering guest checkout can increase conversion rates by up to 45%. Balance convenience with data collection by making guest checkout the default option, while also offering account creation after a successful purchase.
Integrate social login options, like Google, Facebook, and Apple, to alleviate any friction for users who want to create accounts. Use “save information for next time” checkboxes, which will encourage account creation while avoiding a forced feeling. This approach respects customer preferences while still capturing valuable data from willing participants.
D. Recovery Strategies
- Abandoned Cart Emails: Emails sent to recover abandoned carts achieve an open rate of 39.07% and a click-through rate of 23.33%. The first email should be sent within an hour of abandonment, offering an incentive to do so (e.g., 5%-10% off, free shipping). These should be followed up with 2-3 emails scattered throughout the week with similar perks and copy that grabs the reader’s attention.
- Exit-Intent Pop-ups: Pop-ups of abandoned shopping carts can have 17.12% average conversion rates. Trigger these when users show intent to leave the page and offer compelling last-minute incentives to reel them back in using concise and visually appealing messaging. Ensure easy dismissal to avoid frustration while still capturing attention at this crucial moment in the purchase cycle.
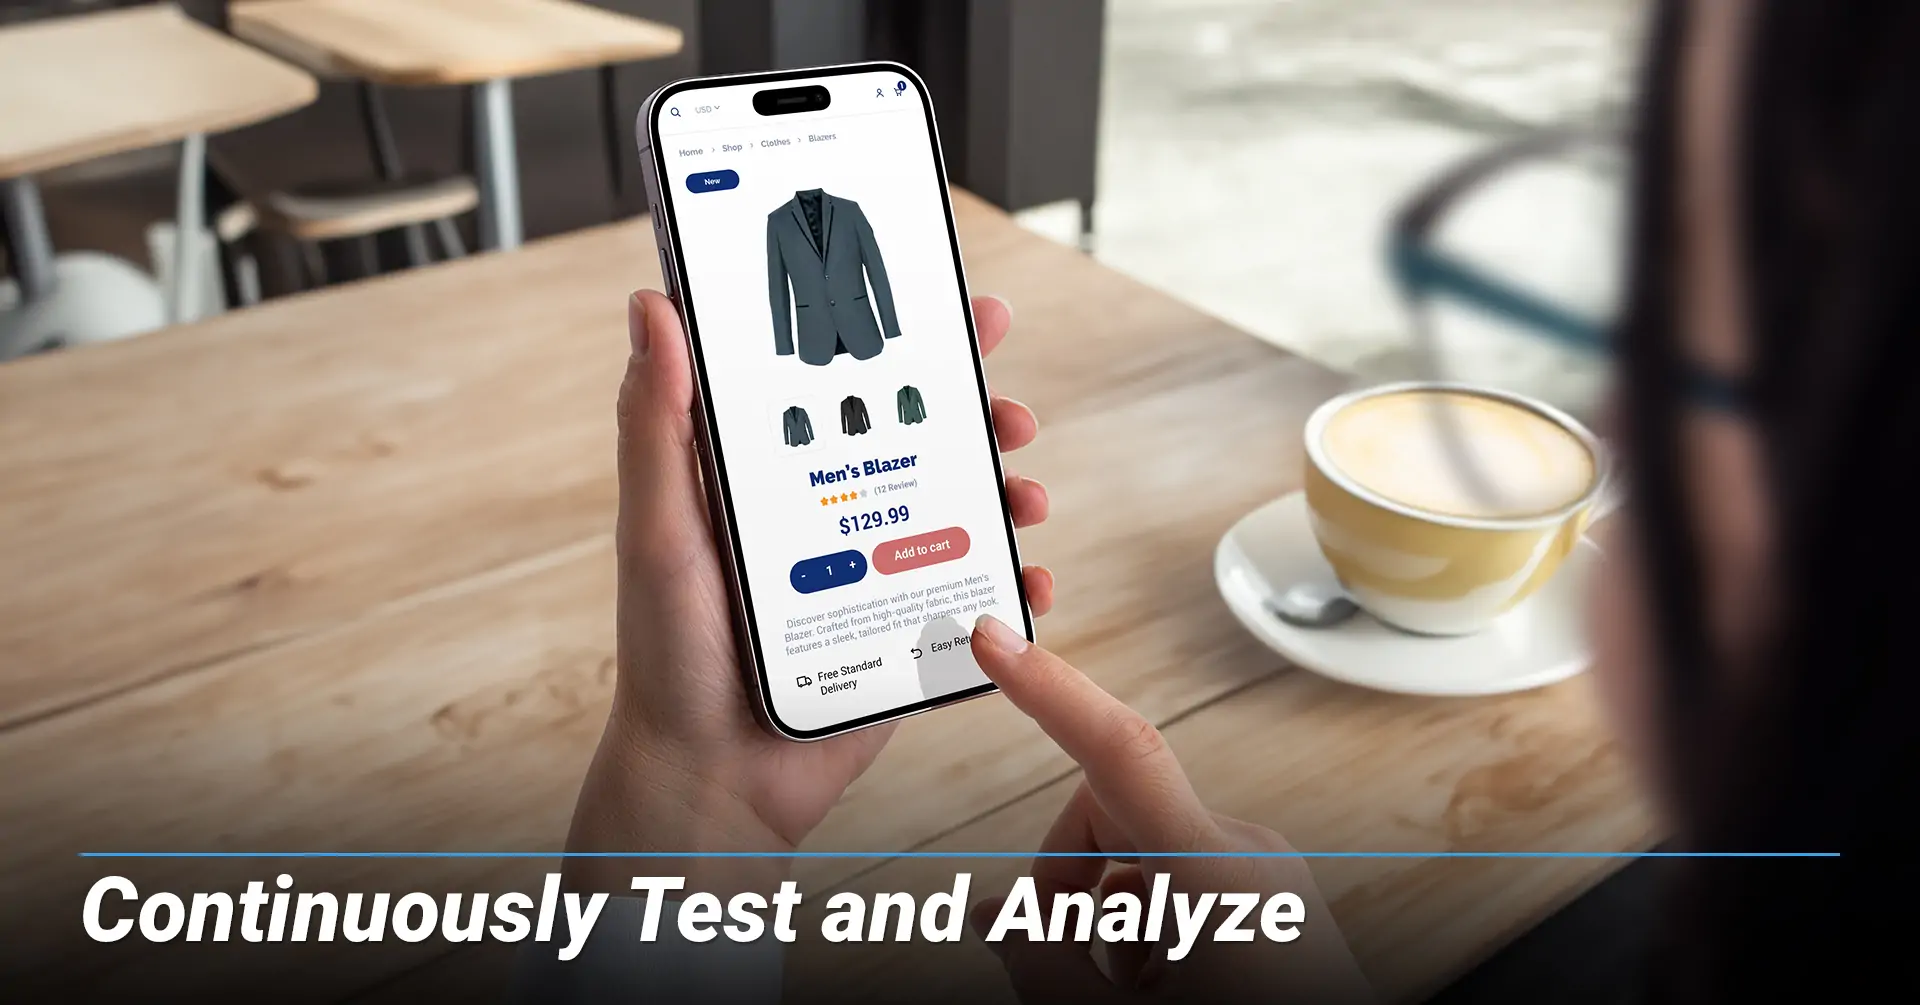
4. Continuously Test and Analyze
A. Mobile Optimization Priority
Mobile optimization reveals significant performance gaps that require immediate attention:
| Device Performance Metric | Desktop | Mobile | Gap |
|---|---|---|---|
| Conversion rate | 5.06% | 2.49% | -51% |
| Traffic share | 27% | 73% | Mobile dominates |
| Cart abandonment rate | 70% | 80.2% | +10.2% |
| Average session duration | Higher | Lower | Attention span difference |
Implement a responsive design that adapts to all screen sizes and optimizes page load speeds to be under 3 seconds. Use large, thumb-friendly buttons and touch targets, integrate mobile payment options like Apple Pay, Google Pay, and Samsung Pay, and simplify navigation with collapsible menus. Ensure forms are easy to complete on small screens, as mobile shopping has nearly become the de facto way to shop.
B. A/B Testing for Continuous Improvement
Systematic testing points out what resonates with one’s target audience. It’s best to focus on high-impact elements that directly affect conversion rates. These include CTA (call-to-action) buttons, product imagery, pricing displays, checkout flows, and trust signals.
It’s best to test one variable at a time for clear results and run tests for at least two weeks to obtain an accurate data set. Ensure statistical significance before implementing changes, document all test results for future reference, and focus on metrics that directly impact revenue rather than less important vanity metrics.
C. Analytics and User Behavior Tools
Utilize different tools to analyze user behavior. Google Analytics 4 is best for event-based tracking and e-commerce insights. Hotjar and Crazy Egg excel at heatmapping for visual representation of user engagement, session recordings for analyzing actual visitor behavior analysis, and conversion funnel analysis to identify specific drop-off points in the customer journey.
Monitor key metrics including overall conversion rate by traffic source, cart abandonment rate and reasons, and average order value and items per transaction. Mobile vs. desktop performance is also something to keep in mind as consumers transition their primary devices used to buying. This data provides the foundation for informed decision-making and optimization down the line.
D. Industry Benchmarks for Context
Understanding your industry’s performance helps set realistic goals and identify opportunities:
| Industry Vertical | Q4 2024 Conversion Rate | Performance Level |
|---|---|---|
| Food and beverage | 3.1% | Highest performing |
| Health and beauty | 1.8% | Above average |
| Active apparel | 1.9% | Above average |
| Electronics and accessories | 1.1% | Below average |
| Luxury handbags | 0.5% | Lowest performing |
| All verticals average | 2.1% | Benchmark |
Key performance indicators to track alongside conversion rates:
| Success Metric | Measurement Focus | Business Impact |
|---|---|---|
| Time on product pages | Engagement depth | Content effectiveness |
| Email signup conversion | Lead generation | Future marketing potential |
| Return customer percentage | Loyalty building | Lifetime value indicator |
| Customer lifetime value | Revenue per customer | Profitability measure |
| Cost per acquisition by channel | Marketing efficiency | Budget optimization |
Conclusion: Increasing e-commerce conversion rates needs a 21st-century blend of intuitive design, compelling visuals, robust trust signals, frictionless checkout, and data-driven optimization. With global e-commerce sales projected to reach $6.86 trillion in 2025, those ahead of the curve will capture a disproportionate market share.
Success comes from treating each visitor as a potential revenue stream. By implementing these four steps strategically and measuring results continuously, your conversion rate will follow suit. Turning more browsers into buyers and building a sustainable competitive advantage in the digital marketplace sets the stage for sustainable, long-term success.
Frequently Asked Questions about Increasing E-Commerce Conversion Rates
1. What is a good conversion rate for e-commerce?
The average e-commerce conversion rate ranges from 2.5% to 3% but does vary by industry. For Shopify stores specifically, the average is 1.4%, with the top 20% achieving 3.2% or higher, and the top 10% reaching 4.7% or above. As a general rule, a “good” rate to aim for is 2.5%.
2. How do I calculate my e-commerce conversion rate?
The formula is as follows: Conversion Rate = (Number of Orders ÷ Number of Website Visits) × 100. For example, if your store receives 1,000 visitors and generates 25 sales, your conversion rate would be (25 ÷ 1,000) × 100 = 2.5%. Most analytics platforms, like Google Analytics and Shopify, will automatically calculate this for you.
3. Why is the mobile conversion rate lower than the desktop?
Desktop conversion rates average 5.06% while mobile rates are significantly lower at 2.49%, despite mobile accounting for 73% of traffic. This gap exists because mobile shopping experiences often have smaller screens, slower load times, and elongated checkout processes. Mobile cart abandonment rates also reach 80.2% compared to 70% on desktop.
4. What are the main reasons customers abandon their shopping carts?
The top reasons for cart abandonment are: 48% due to high shipping costs, 26% due to mandatory account creation, 25% citing slow delivery times, 18% due to complicated checkout processes, and 17% due to not trusting the site with payment information. Addressing these issues will quickly increase conversion rates.
5. How important are product images for conversions?
Product images are crucial; high-quality photos have a 94% higher conversion rate than low-quality images. Sixty percent of shoppers need to see at least three to four images before feeling confident enough to make a purchase, and 90% consider product visuals the most important factor in their buying decision. Including at least one product image increases conversion rates by two times compared to listings without images.
6. Does offering free shipping really increase conversions?
Yes. Eighty percent of customers are willing to meet minimum purchase thresholds to qualify for free shipping. Offering this can reduce cart abandonment by up to 18%. Customers are 88% more likely to complete their purchase when they see free shipping options. Consider incorporating shipping costs into product prices or setting minimum order values.
7. How do customer reviews impact conversion rates?
Customer reviews are extremely powerful, as 99.9% of shoppers check reviews before purchasing online. Displaying both positive and negative reviews increases trust, with 68% of consumers trusting reviews more when both are present. Reviews serve as social proof and can significantly influence purchasing decisions.
8. What’s the difference between conversion rates by industry?
Conversion rates vary across different industries. Food and beverage lead at 3.1%, while luxury handbags convert at only 0.5%. Electronics and accessories average 1.1%, while the overall average across all verticals is 2.1%. Higher-priced items typically have lower conversion rates due to longer consideration periods.
9. How can A/B testing improve my conversion rate?
A/B testing makes it easy to compare different versions of your website elements to see what works best for your target audience. E-commerce businesses with average conversion rates of 2.5% to 3% can see increases after testing. Focus on high-impact elements, like call-to-action buttons, product images, pricing displays, and checkout processes. Run tests for at least two weeks to ensure statistical significance.
10. Should I prioritize increasing traffic or improving conversion rates?
While the current trend is to increase website traffic, the most effective way to drive sales in this AI era is to grow your conversion rate. Also, improving conversion rates is often more cost-effective than acquiring new traffic because it maximizes the value of visitors already present. A small improvement in conversion rate can generate more sales from the same amount of traffic. This leads to a higher ROI on your existing marketing spend.